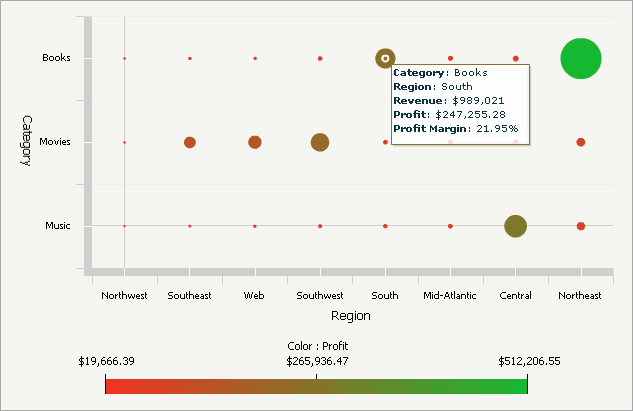
The Bubble Grid widget allows an analyst to quickly identify important trends or anomalies in data, relative to the total contribution of accompanying data.

You can enable the bubbles in the widget as selectors, so that clicking a bubble updates all target Grid/Graphs and panel stacks in the dashboard that display data related to the bubble.
Related topics