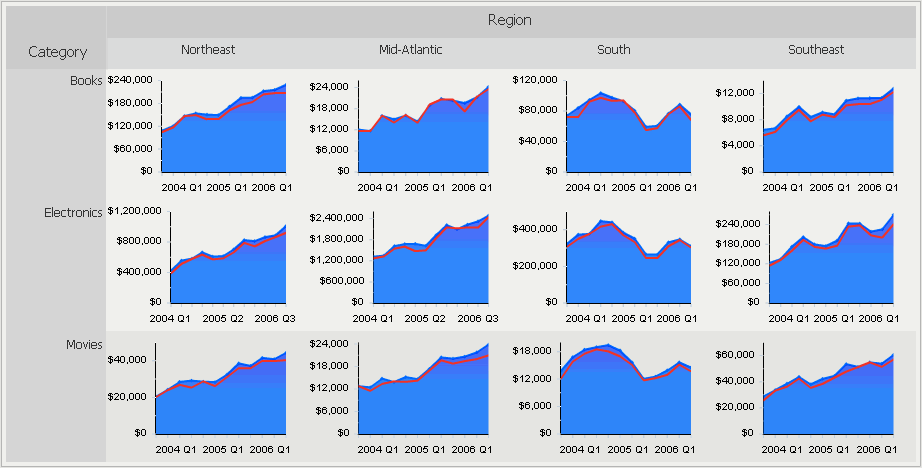
The Graph Matrix widget allows you to quickly analyze various trends across several metric values.

You can maximize a specific area graph by double-clicking it. The graph opens in a new window.
Once you place a widget in your document, you must place report objects such as attributes and metrics on the Grid/Graph to define it, as for any grid report.
Related topics