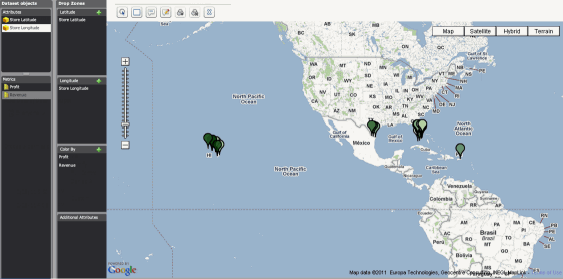
The Google Map visualization allows you to
display locations as map markers on a map. You can:
The table below contains a list of actions you can perform when viewing
data in a Google Map visualization, and steps to perform each task.
|
Actions |
Steps |
|
Zoom in or out of the map display |
Click the indicator on the slider
located on the left side of the map, then do one of the following: |
|
Pan the map display to display a different region of the map |
Click on the map, then drag it in
the direction you want to pan the map display. |
|
Select locations in the map by clicking individual map markers |
From the Google Map's toolbar, click
the Mouse Click Selection icon
 . .
Click a map marker to select it. You
can select multiple map markers by pressing CTRL
and clicking additional map markers. |
|
Select locations in the map by drawing a rectangular lasso shape |
From the Google Map's toolbar, click
the Rectangular Area Selection
icon  . . Click and drag on the map to enclose
a set of map markers within a rectangle shape. All the map markers within
the rectangle are selected. |
|
Display additional location information when the cursor is hovered over
a map marker in the widget |
From the Google Map's toolbar, click
the View Information Window icon
 .
When you hover the cursor over a map marker in the visualization, an Information
Window is displayed. .
When you hover the cursor over a map marker in the visualization, an Information
Window is displayed. |
|
Edit the contents of the Information Window displayed when the cursor
is hovered over a map marker in the visualization
By default, the names and values of each attribute and metric added
to the visualization by the designer are displayed in the Information
Window. You can customize the display by adding HTML, plain text, or attribute
and metric values to the Information Window. |
From the Google Map's toolbar, click
the Edit Information Window icon .
The Edit Custom Information Window dialog box opens. .
The Edit Custom Information Window dialog box opens. In the field, type the text you want
to display in the Information Window, as follows:
To display
the value of an attribute or metric, type ${Name},
replacing Name with
the name of the attribute or metric whose value you want to display. The
text is replaced with the value of the attribute or metric when the Information
Window is displayed.
Note: Once you have modified the contents of the Information
Window to display custom information, you can choose to revert these changes
and display the default Information Window instead. To do so, delete the
contents of the field in the Edit Custom Information Window dialog box,
then click OK. Your changes are
reverted.
Click OK.
Your changes are saved. |
|
Display only the selected map markers on the map, or display all map
markers except those currently selected |
Select map markers in the visualization
by doing one of the following:
To select
locations in the map by clicking individual map markers, from the Google
Map's toolbar, click the Mouse Click
Selection icon . Click a map marker to select it. You can select multiple
map markers by pressing CTRL and clicking additional
map markers.
To select
locations in the map by enclosing them in a lasso shape, from the Google
Map's toolbar, click the Rectangular
Area Selection icon . Click and drag on the map to enclose a set
of markers within a rectangle. All the map markers within the rectangle
are selected.
To filter the map markers displayed
in the map, do one of the following: |
|
Clear all map marker selections |
From the Google Map's toolbar, click
the Clear Selections icon  .
All map marker selections are cleared. .
All map marker selections are cleared. |
 .
Only the map markers you selected are displayed.
.
Only the map markers you selected are displayed. . All the map markers except those you selected are displayed.